How to Build an SEO Dashboard Using AI

An SEO dashboard helps you see how your website is performing in search engines, which pages are bringing in traffic, and whether that traffic is generating business results.
In this guide, we’ll show you how to use AI to turn data from Google Analytics 4 (GA4) and Google Search Console into a simple SEO dashboard. We’ll also show you how to include AI search visibility, so you can understand how your company appears in tools like ChatGPT and Claude.
What You’ll Learn
- Which SEO and AI visibility KPIs belong on an executive scorecard
- How to connect organic performance with leads, pipeline, and revenue
- How to measure brand mentions, citations, and accuracy in AI answers
- How to turn reporting data into a clear quarterly narrative
- Copy-paste prompts for creating each part of the report
1. Gather Your SEO Data
Start by exporting data from two free Google tools:
- Google Analytics 4: Shows how much organic traffic your website receives, which pages visitors view, and what actions they take.
- Google Search Console: Shows which keywords bring visitors to your site, where your pages rank, and how often people click on your search results.
Export data for the past three months, along with the previous three months so you can compare performance.
You can install a browser plugin like Claude for Chrome or ChatGPT for Chrome and use the prompt below to have it pull this data automatically.
Gather My SEO Data
Open Your Google Analytics 4 and Google Search Console tabs.
Visit Google Analytics 4 and Google Search Console for [WEBSITE URL].
Gather the following data for the past three complete months, compared with the previous three months:
- Google Analytics 4: Organic search traffic, top landing pages, and conversions.
- Google Search Console: Search clicks, impressions, top keywords, and average search position.
Organize the results into simple tables, showing the current period, previous period, and percentage change.
Use only data you can verify. If you can’t access something, let me know.
2. Use AI to Build Your SEO Dashboard
Upload your data from Step 1 into ChatGPT, Claude, or another AI tool. Ask it to organize your most important SEO metrics into a dashboard using the prompt below.
Create My SEO Dashboard
Upload Your GA4 and Google Search Console exports from Step 1.
Create a simple SEO dashboard using the attached data.
Show organic traffic, search clicks, impressions, top-performing pages, and conversions where available.
Compare results with the previous period and highlight the biggest increases and decreases.
Present the results in clear tables and charts, with a short summary of what the numbers mean.
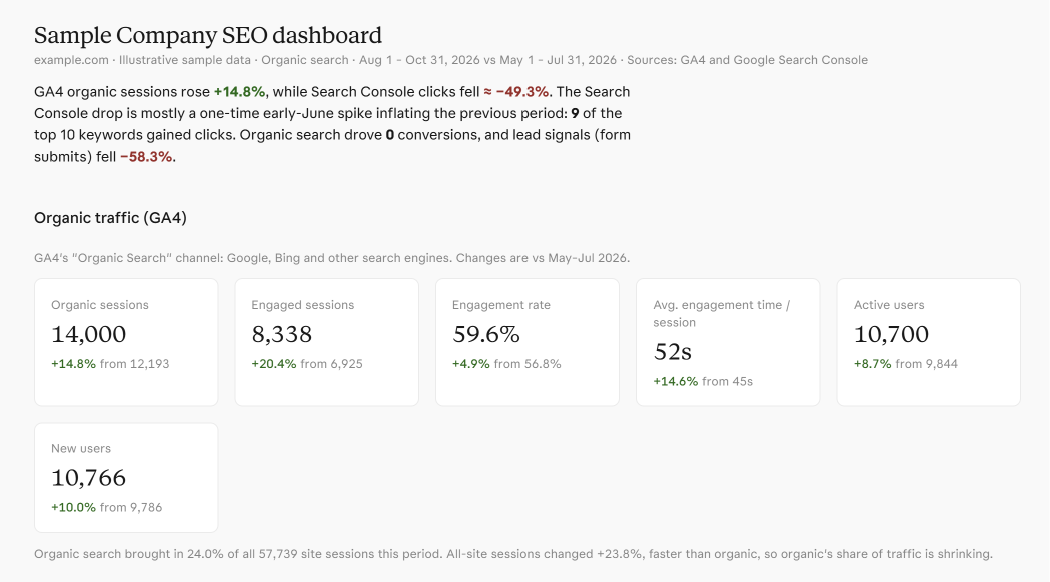
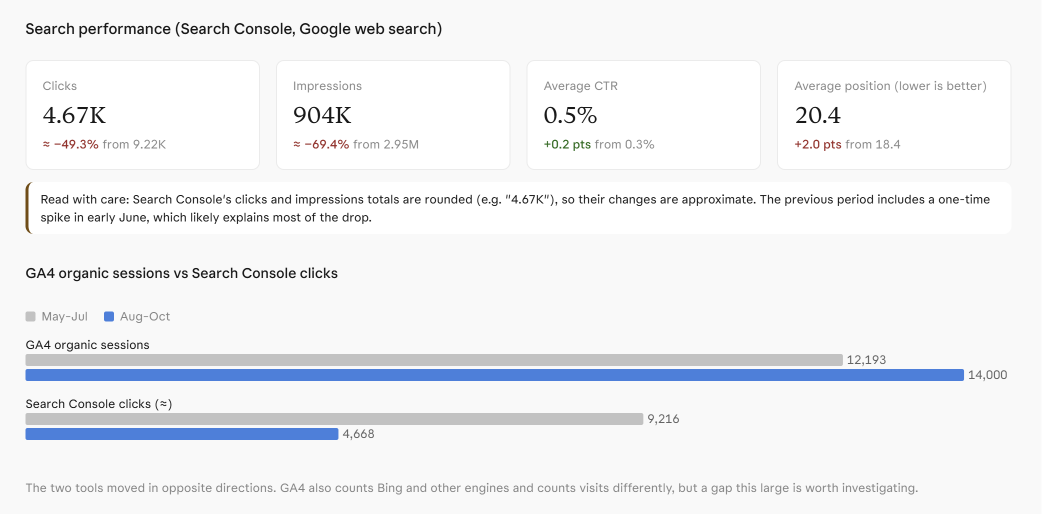
Sample dashboard produced in Claude using these instructions, in about 15 minutes.
3. Add AI Search Visibility
Traditional SEO metrics tell you how people find your website through Google. But buyers are increasingly using AI assistants like ChatGPT, Claude, and Gemini to research products and services.
To understand how visible your company is in AI search, monitor whether these assistants recommend your business, mention your competitors, and link to your website.
You can start by testing a few questions that your customers are likely to ask. Using the Claude for Chrome or ChatGPT for Chrome browser plugins, use the prompt below.
Identify AI Search Questions to Monitor
Open ChatGPT, Google Gemini, and Claude in separate tabs.
My company is [COMPANY], and our website is [URL]. We sell [PRODUCT] to [TARGET AUDIENCE].
Suggest five questions potential customers might ask AI assistants when researching products or services like ours.
Visit ChatGPT, Google Gemini, and Claude, asking these questions and seeing whether our company appears in their answers.
Generate a report on your findings.
4. Ask AI What the Data Means
A useful SEO dashboard does more than display numbers. It helps you understand what’s changing and what actions could improve your results.
For example, AI might identify a page that’s losing traffic, a keyword that’s close to reaching Google’s first page, or a high-traffic article that isn’t generating conversions.
Analyze My SEO Data
Upload Your SEO dashboard and data gathered above
Review my SEO dashboard and identify:
- Three things that are working well.
- Three problems or opportunities worth investigating.
- The three most important actions we should take next.
Explain your recommendations in plain English, using the data to support them. Flag anything that needs further investigation.
5. Keep Your Dashboard Updated
Refresh your dashboard each month using new data from GA4 and Google Search Console.
Look for trends rather than reacting to every small change. Are your important pages attracting more visitors? Are more visitors converting into leads? Is your company appearing more often in AI-generated answers?
Over time, your dashboard should help you make better decisions about where to focus your marketing efforts.
How Media Shower Makes SEO Reporting Easier
Media Shower does all this for you.
Our AI marketing platform helps you go beyond traditional SEO dashboards. It analyzes your website, competitors, and AI search visibility to identify opportunities and recommend what to do next.
Instead of simply showing you more numbers, Media Shower helps you understand what the numbers mean, and what to do next.
Frequently Asked Questions About SEO Dashboards
Which SEO KPIs should leadership see?
Start with organic-sourced pipeline or revenue and qualified conversions. Add visibility metrics that explain how buyers find you, such as non-branded clicks or high-intent search coverage. Include AI visibility when it informs a decision.
Should organic traffic appear in the report?
Yes. Pair traffic with qualified conversions, conversion rate, pipeline, and landing-page intent. This shows whether growth came from prospective buyers and whether those visitors completed valuable actions.
Can you tie AI visibility to revenue?
Direct AI referral conversions can sometimes be measured. Broader influence is harder to attribute because buyers may return through branded search, direct traffic, or another channel. Report measurable referrals separately and label correlations clearly.
How often should I report these KPIs?
Use the quarterly review for investment decisions and monthly reporting to track progress. Investigate tracking failures, major traffic declines, and inaccurate AI answers as they arise so the team can act before the next review.
How many KPIs belong on the dashboard?
Aim for six to ten. Keep KPIs that show business value, progress toward a target, competitive position, or a material risk. Put detailed diagnostics in the appendix so you can pull them up if asked.
See What Your Marketing Is Missing
Start your free Media Shower trial and get personalized insights on your SEO, competitors, AI visibility, and what to do next.