The Better Marketing Blog
Better tips, tools, and tactics for the AI era.
Better tips, tools, and tactics for the AI era.

A good SEO keyword report should tell you where search visibility is creating opportunity, where valuable traffic is at risk, and what to do next. Unfortunately, most SEO keyword reports are page after page of incomprehensible data.
We’ve been doing SEO since before SEO was even a thing, and we’ll show you how to read an SEO keyword report without getting distracted by hundreds of low-impact movements.
We’ll also give you AI marketing prompts for improving your SEO reports: how to detect changes, measure keyword churn, and turn the findings into a great SEO progress report.

Here is a 5-step process to creating an SEO keyword report with AI.
Marcus, a marketing manager at a B2B cybersecurity company, has SEO data in several places. Search Console shows the queries that generated impressions and clicks, while the company’s rank tracker monitors a smaller set of priority keywords. GA4 shows which landing pages produced demo requests.
For his monthly report, Marcus downloads current and previous-period data from each source. Together, the files show which rankings changed, whether those changes affected traffic, and which landing pages contributed to business results.
You have several options for gathering the data:
For most marketers, Google Search Console is the easiest starting point:
Search Console report exports contain up to 1,000 representative table rows. Larger sites may need the Search Console API or an ongoing BigQuery export to analyze more of their query and page data.
Search Console shows the queries for which Google recorded visibility. A rank tracker follows a keyword list selected by your team, including commercially important terms that may have produced few or no impressions.
Keep the source attached to every row. Rankings from different tools should only be compared when their dates, devices, locations, and methods are compatible.
To connect keyword changes with results, add a GA4 landing-page export or another conversion report. Include the outcomes your company values, such as demo requests, qualified leads, trials, purchases, or revenue.
You usually can’t match a conversion to an individual Search Console query. The landing page provides the connection: keyword data shows which queries and pages gained visibility, while analytics shows what visitors did after arriving.

Prompt: Prepare keyword data for analysis
Upload: Current and previous-period Search Console or rank-tracker exports, plus an optional GA4 landing-page export.
Act as an SEO reporting analyst. Review and prepare the attached files for keyword-change analysis.
Create a normalized table containing, where available:
Keep data from different tools clearly labeled. Flag incompatible periods, filters, locations, devices, missing fields, and export limitations.
Return:
With the comparison validated, Marcus sorts the report by position change. A keyword that moved from position 63 to 48 appears near the top, but it generated four impressions and no clicks. Farther down, a product-comparison query moved from position 11 to 8, received 3,700 impressions, and contributed to five demo requests during the quarter.
The second movement is smaller, but it crosses into the top 10, reflects high commercial intent, and supports the sales pipeline. The size of the movement tells only part of the story.
A ranking change becomes material when it changes traffic, business opportunity, or risk.
Score each movement against:
Use thresholds relevant to your business. A change from position 11 to 8 can create more opportunity than a change from position 70 to 40.
Give each factor a score from 1–5.
Priority score = business value × traffic potential × magnitude × confidence ÷ effort
Then place each change into an action category:
Google advises against drastic action after a small decline such as position 2 to 4, while a larger drop such as 4 to 29 warrants deeper assessment.
Prompt: Identify the ranking changes that deserve attention
Upload: Validated keyword report, Search Console query-page export, conversion report, and definitions of high-value topics.
Review keyword performance for [REPORTING PERIOD] as a senior SEO strategist.
Score each consequential change from 1–5 for:
Use each query-and-landing-page combination as the unit of analysis.
Classify each change as:
Return:
Marcus finds that “vendor risk management software” moved from position 5 to 12. His first instinct is to rewrite the page. Before assigning the work, he checks the complete query-page record.
Impressions are stable, clicks have fallen, and a different URL now ranks for the keyword. The product page and an educational guide may be competing for the same search. Marcus changes the action from “refresh the product page” to “clarify each page’s intent and strengthen internal links pointing to the preferred URL.”
Start by checking whether the URL switched once or whether both pages keep appearing for the same search.
In Search Console, select the query and open the Pages tab for each period. Compare which URLs appeared and how clicks and impressions shifted between them. Then check which page best answers the query and where your internal links point.
If losses spread across several queries or page groups, use the organic traffic-drop guide to investigate broader causes.
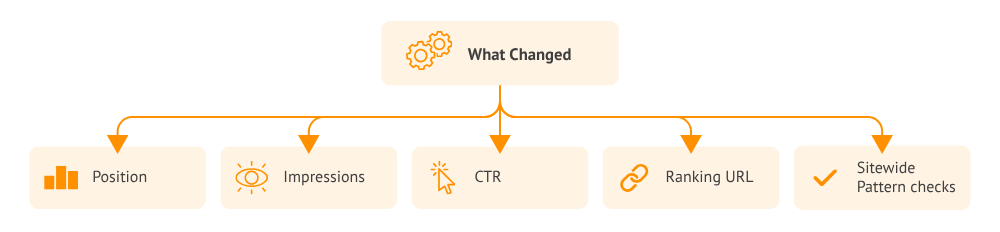
Prompt: Investigate a ranking URL change
Upload: Search Console query-page data for both periods, the affected URLs, and internal-link data if available.
For each priority query, compare the URLs that appeared in both periods and show how clicks, impressions, and position changed for each URL.
Flag cases where the evidence shows a persistent switch, repeated alternation, or too little data to tell.
Check which page best answers the query and whether internal links point to that page. Tie each recommended change to the evidence supporting it.
Return a table with the query, URLs, evidence, preferred page, next action, and what to monitor.
At the quarterly review, Marcus sees that the company ranks for 18% more keywords. That sounds like straightforward growth. He also finds that 27% of the keywords present last quarter are absent from the current tracked set.
Many losses are low-value informational searches, but others cover pricing and implementation questions used by late-stage buyers. The total keyword footprint has grown while commercially valuable parts of the portfolio have weakened.
Marcus adds keyword churn to the report so leadership can see both acquisition and retention of search visibility.
Keyword churn shows how much of the previous period’s ranking footprint disappeared:
Keyword churn rate = keywords ranking in the previous period but absent now ÷ keywords ranking in the previous period × 100
For example, suppose a site ranked for 2,000 tracked keywords last quarter, and 440 are absent this quarter:
440 ÷ 2,000 × 100 = 22% keyword churn
The 22% figure becomes useful after segmentation. Losing 22% of low-value informational terms tells a different story from losing the same share of product, pricing, and comparison terms.
Use a consistent tracked keyword set or a complete data source. An absent row in a limited export doesn’t prove a ranking loss. If you’re explaining where additional clicks came from, use the monthly reporting guide’s click-gain breakdown.

Prompt: Calculate quarterly keyword churn
Upload: Previous and current-quarter keyword datasets with query, landing page, intent, category, and position.
Compare the attached quarterly keyword datasets and calculate keyword churn.
Using a consistent keyword universe, classify each query as:
Calculate keyword churn as the share of the previous period’s ranking keywords that are absent in the current period.
Segment the results by:
Return the churn rate, underlying counts, highest-value losses, strongest gains, methodology, and data limitations. Classify absent export rows as unclassified until comparable data confirms a ranking loss.
Marcus validates 74 declines and starts with three that warrant action. One threatens an important product page, one reveals competing URLs, and one affects a high-converting comparison guide.
He also highlights two opportunities: a pricing query entering the top 10 and an implementation cluster gaining impressions. Each finding receives an owner, action, and measurement date.
Record the evidence, owner, and review date for each action. Keep the underlying query and URL data handy so the team can check whether the intended page gains or recovers visibility.
To summarize the findings for leadership, use the worked monthly SEO report.
Prompt: Build a keyword action list
Upload: Prioritized keyword analysis, conversion data, activity log, and team capacity.
Turn the prioritized keyword analysis into a worklist for the SEO team. Focus the list on changes that warrant action or active monitoring.
For each item, include the query, affected or preferred URL, evidence, next step, owner, and measurement date.
Specify what to measure. Use the ranking URL for competing pages, clicks and visibility for ranking changes, and landing-page conversions where the data supports them.
Flag data limitations that could change the recommended action.
A keyword report is useful when it shows which ranking changes matter to buyers and which pages need attention.
Media Shower connects keyword movements to ranking URLs, landing-page performance, and business priorities so your team can see which searches are worth protecting or improving.
An SEO keyword report shows how a website performs for selected searches. It commonly includes current and previous positions, impressions, clicks, CTR, ranking URLs, and changes over time. The most useful reports also connect keyword movements to landing-page performance, conversions, and recommended actions.
Check priority commercial keywords weekly when you are actively updating related pages or investigating a decline. A monthly review usually provides enough context for broader reporting, while quarterly analysis can reveal churn and changes in your overall search footprint. Use longer comparison periods for seasonal or volatile searches.
There is no universal number. Consider the ranking threshold, impression volume, clicks, intent, and business value. Moving from position 11 to 8 may matter greatly because the result enters the top 10. Moving from position 70 to 50 may create little immediate traffic opportunity.
Search demand or CTR may have fallen even though average position improved. The ranking could also have improved for a low-volume variation while declining for a more valuable query. Compare position with impressions, clicks, CTR, landing pages, devices, and countries before deciding what happened.
Use both when possible. A rank tracker monitors a consistent keyword set and can support regular checks. Search Console shows the queries that generated impressions and clicks for your site. Matching each query with its landing page provides a stronger basis for diagnosis than either source alone.
Start your free Media Shower trial and get personalized insights on your SEO, competitors, AI visibility, and what to do next.