The Better Marketing Blog
Better tips, tools, and tactics for the AI era.
Better tips, tools, and tactics for the AI era.

Visitors referred by ChatGPT can be highly engaged, but our analysis found no consistent engagement advantage over Google organic traffic. Across all our B2B websites, ChatGPT and Google organic engagement rates stayed within two percentage points of each other.
The practical takeaway: AI-referred traffic is similar to Google-referred traffic in user engagement. For marketers, engagement rate should also be evaluated alongside leads, pipeline, and sales. Below, we’ll show you how to make that comparison with AI.
We analyzed traffic for four B2B marketing websites of different sizes from July 1 through September 30, 2026.
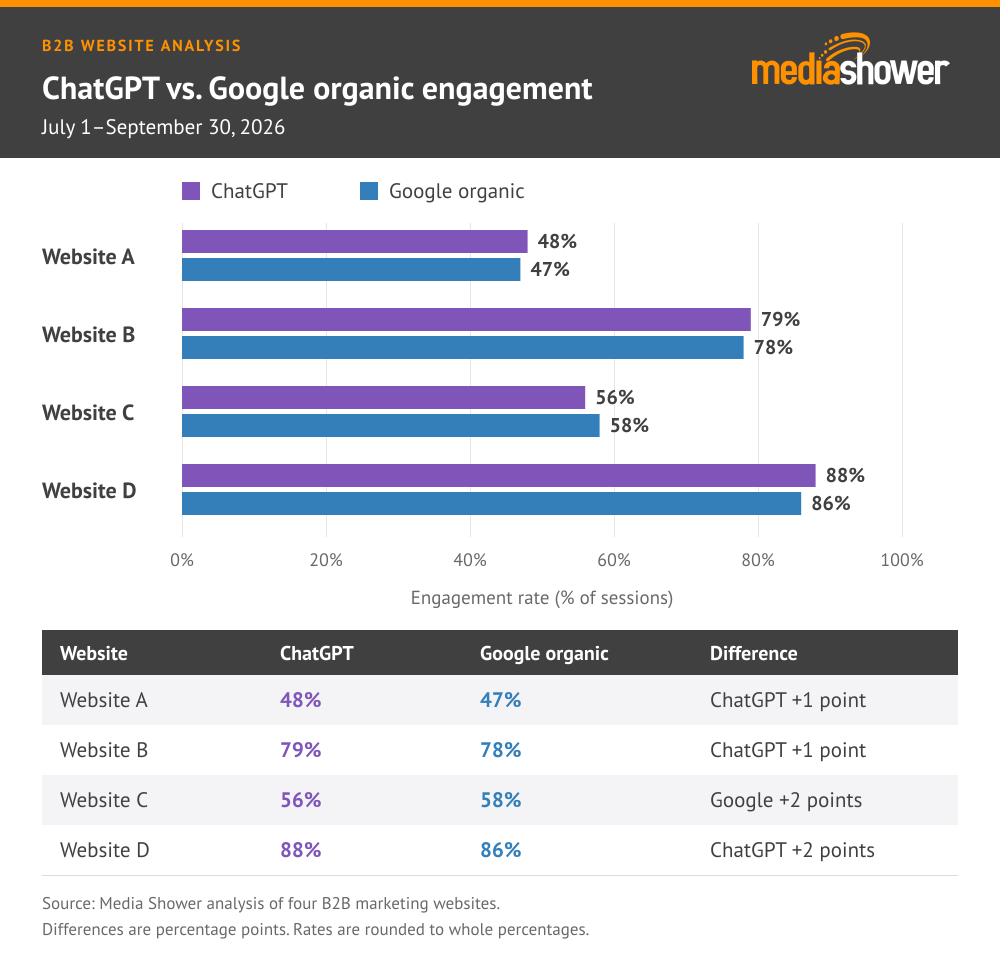
ChatGPT engagement ranged from 48% to 88%, while Google organic ranged from 47% to 86%. For every website, the two channels were within two percentage points.
Our finding does not mean that ChatGPT traffic will match Google traffic for every B2B company. It shows that ChatGPT referrals are likely to deliver meaningful on-site engagement, on par with Google-referred traffic.
Prompt: Find the story in your channel comparison
Upload: A GA4 CSV export containing session source, sessions, engaged sessions, and engagement rate for a single reporting period.
Act as a B2B marketing analyst.
Compare ChatGPT-attributed traffic with Google organic traffic in the attached GA4 export.
Use these rules:
Return:
Google Analytics defines it like this:
Engagement rate = engaged sessions ÷ total sessions
By default, GA4 considers a session engaged when it meets at least one of these conditions:
The engagement-time threshold can be adjusted in a property’s web data-stream settings, so teams should confirm their configuration before comparing results across properties.
A session represents a period of interaction with a website or app. One person can start several sessions, and GA4’s default session timeout is 30 minutes of inactivity.
Engagement rate is therefore a useful signal of visit quality. It does not independently show that the visitor became a lead, influenced pipeline, or purchased.
The configured key events also affect the result. If a company defines a low-intent action as a key event, sessions containing that action may qualify as engaged. Before interpreting channel differences, review which events count as key events and whether they represent meaningful behavior.

Engagement rate 100%
GA4’s User acquisition and Traffic acquisition reports answer different questions:
For this analysis, use the Traffic acquisition report because engagement rate is being compared at the session level.
GA4 defines Session source / medium as the source and medium that referred a particular session. The value can change each time someone returns through a different channel.
Referral reporting also has practical limits. Missing referral information, redirects, and other tracking issues can cause sessions to appear as direct traffic. Your report represents the ChatGPT traffic GA4 successfully attributed; it may not capture every visit influenced by an AI answer.
Prompt: Build a ChatGPT-versus-Google analysis with a browser agent
Upload: Use GA4 directly through a browser agent such as ChatGPT Work or Claude in Chrome.
Open our GA4 Traffic acquisition report and prepare a comparison of ChatGPT-attributed sessions and Google organic sessions.
Follow these instructions:
Finish with a methodology note containing the date range, report name, dimensions, metrics, and filters.
Start with three questions:
A high rate based on a small number of sessions can move sharply from month to month. Always display the session count next to the engagement rate. (Remember the average website receives <1% of traffic from ChatGPT.)
ChatGPT may refer visitors to detailed educational articles, while Google organic sends a broader mix to product pages, job listings, and support content. Landing-page mix can explain part of the engagement difference.
Look across several months and page categories. A recurring pattern provides stronger decision support than one isolated period.
Engagement tells you whether visitors stuck around on your site. But business outcomes tell you whether those sessions supported growth.
Build a scorecard containing:
GA4’s session key event rate measures the percentage of sessions in which a key event occurred. That makes it a natural next metric after engagement rate, provided your key events are configured around meaningful actions.
Your next action is straightforward: review ChatGPT and Google organic engagement beside business outcomes for the same reporting period. This reveals whether AI referral traffic deserves additional content, measurement, or optimization work.
Prompt: Turn engagement data into a channel decision
Upload: A GA4 acquisition export plus a CRM export containing leads, qualified leads, opportunities, and revenue by source.
Act as a B2B demand generation analyst.
Join the attached GA4 and CRM data to compare ChatGPT-attributed traffic with Google organic traffic for [DATE RANGE].
Use the strongest reliable matching field available. Clearly explain any attribution or matching limitations.
Calculate where possible:
– Sessions.
– Engagement rate.
– Key event rate.
– Leads.
– Session-to-lead rate.
– Qualified leads.
– Opportunities.
– Pipeline.
– Revenue.
Return:
1. A side-by-side scorecard.
2. Three findings supported by the data.
3. The single most important recommended action.
4. A confidence rating for each finding.
5. Measurement improvements needed for the next reporting period.
Media Shower tracks AI referrals alongside organic search and connects each source with the landing pages and outcomes your team measures. That gives you a recurring view of how much traffic each source sends and whether those visits lead to meaningful actions.
Our B2B analysis found comparable engagement. From July 1 through September 30, 2026, every website’s ChatGPT and Google organic engagement rates were within two percentage points. Your result may vary.
The average engagement rate between sites we measured was 67%, though the individual websites varied between 47% and 86%.
Engagement rate measures the percentage of sessions classified as engaged. A single visitor can generate multiple sessions. Use user metrics when answering questions about people and session metrics when evaluating what happened during individual visits.
Start with the Traffic acquisition report and inspect session-level source or source/medium values. Use the prompt above to help find it using an AI browser plugin.
First measure, then manage. See what your engagement rate is today, how much traffic you’re receiving, and ChatGPT traffic’s impact on your business. Resource decisions become easier when the channel also demonstrates business impact or consistent growth.
Monthly monitoring works well for many B2B teams, with quarterly analysis providing a more stable strategic view. Companies with limited AI referral volume may need longer comparison periods before interpreting changes. If Google organic traffic drops between comparisons, use the organic traffic-drop guide to investigate the cause.
Start your free Media Shower trial and get personalized insights on your SEO, competitors, AI visibility, and what to do next.