The Better Marketing Blog
Better tips, tools, and tactics for the AI era.
Better tips, tools, and tactics for the AI era.

Marketing teams have plenty of data. Between Google Analytics, Search Console, CRM dashboards, SEO platforms, project-management software, and AI visibility tools, finding another number is rarely the problem.
The real challenge is figuring out which numbers answer the questions executives are asking in the age of AI.
In this guide, we’ll show you the questions you should be asking, the metrics you should be measuring, and where to find them.
Search traffic falls for all sorts of reasons. Rankings slip, demand changes, or competitors write better titles. New search features answer the question before anyone needs to click.
AI Overviews have added one more possibility. Before giving them all the blame, check whether your site is actually losing visibility or still appearing in search without attracting as many visits.
Google Search Console
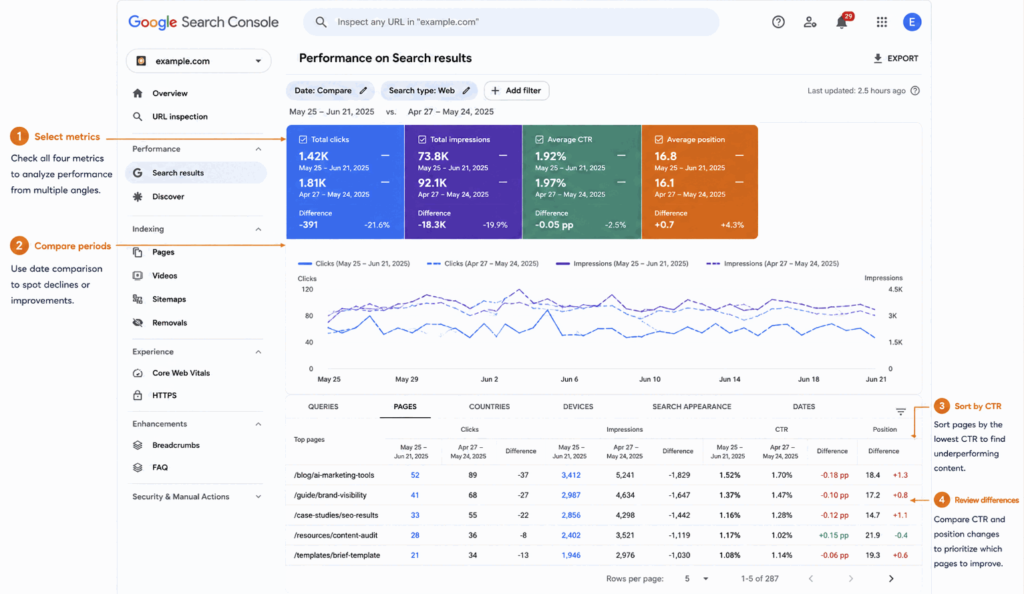
Open Google Search Console → Performance → Search Results.
Start with these four metrics:
These numbers become much more useful when you read them together. If impressions and average position stay relatively steady while clicks and CTR fall, your site is still visible. Something about the search experience has changed.
Search Console cannot tell you exactly what changed. AI Overviews may be involved, but so could featured snippets, stronger competing listings, changing intent, or other search features.
Look for patterns that stick around long enough to matter:
Compare the last three or six months with the period before it. A rough week happens, but a steady slide deserves a closer look.
Start with pages that are losing clicks while holding their visibility. Search their leading queries yourself and look at the results your customers now see.
A stronger title or meta description may help when competing listings have become more appealing. If the search result already answers the basic question, give people another reason to visit. Original research, proprietary data, expert analysis, useful visuals, templates, and interactive tools can all help further boost clicks.
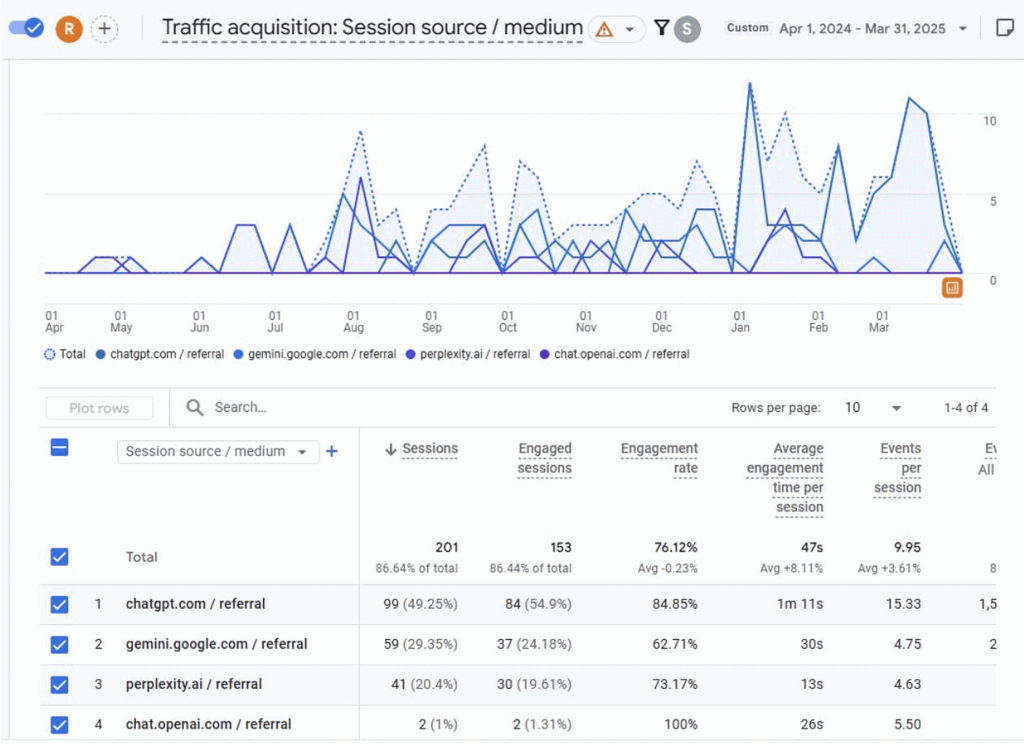
AI assistants are now a measurable source of website traffic. Google Analytics can show which platforms send visitors, where those visitors land, and what they do next.
The numbers may look small beside organic search. That’s fine. A modest source can still matter if its visitors stay longer, explore more, or complete valuable actions.
Google Analytics 4
Open Reports → Acquisition → Traffic acquisition.
Change the primary dimension to Session source / medium, then search or filter for known AI referral domains. You may see entries such as:
These values can change as platforms update their domains and routing. Check the sources that actually appear in your GA4 property instead of relying on a permanent master list. AI platforms have a habit of moving the furniture.
Sessions are a good starting point. Then look at what those visitors do:
Someone arriving from an AI assistant may already know the basics because the platform summarized the subject before presenting the link. That means AI-referred traffic is usually much higher quality.
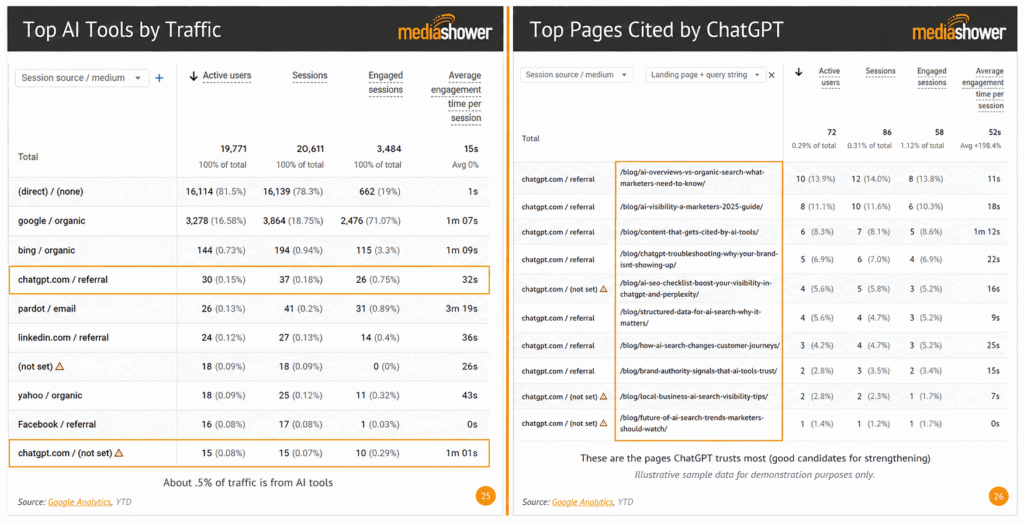
Look closely at the pages receiving repeat AI referrals. What do they have in common? You may find clear explanations, strong sources, original insights, or enough depth to help an AI platform build a useful answer.
A referral tells you that an AI platform linked to the page during a user interaction. It won’t explain every reason the page was chosen, but recurring patterns can give your content team a useful trail to follow.
Referral traffic tells you when someone clicked a link from an AI platform. AI visibility answers a wider question: Does your brand appear when customers ask relevant questions, even when nobody clicks?
A mention, a citation, a recommendation, and a website visit are four different things. Your reporting should keep them separate.
Media Shower AI Visibility reporting or a dedicated AI visibility platform
Media Shower clients receive AI Visibility reporting in their monthly client presentations. The report shows AI referral traffic, the pages receiving those visits, and the content themes appearing most often.
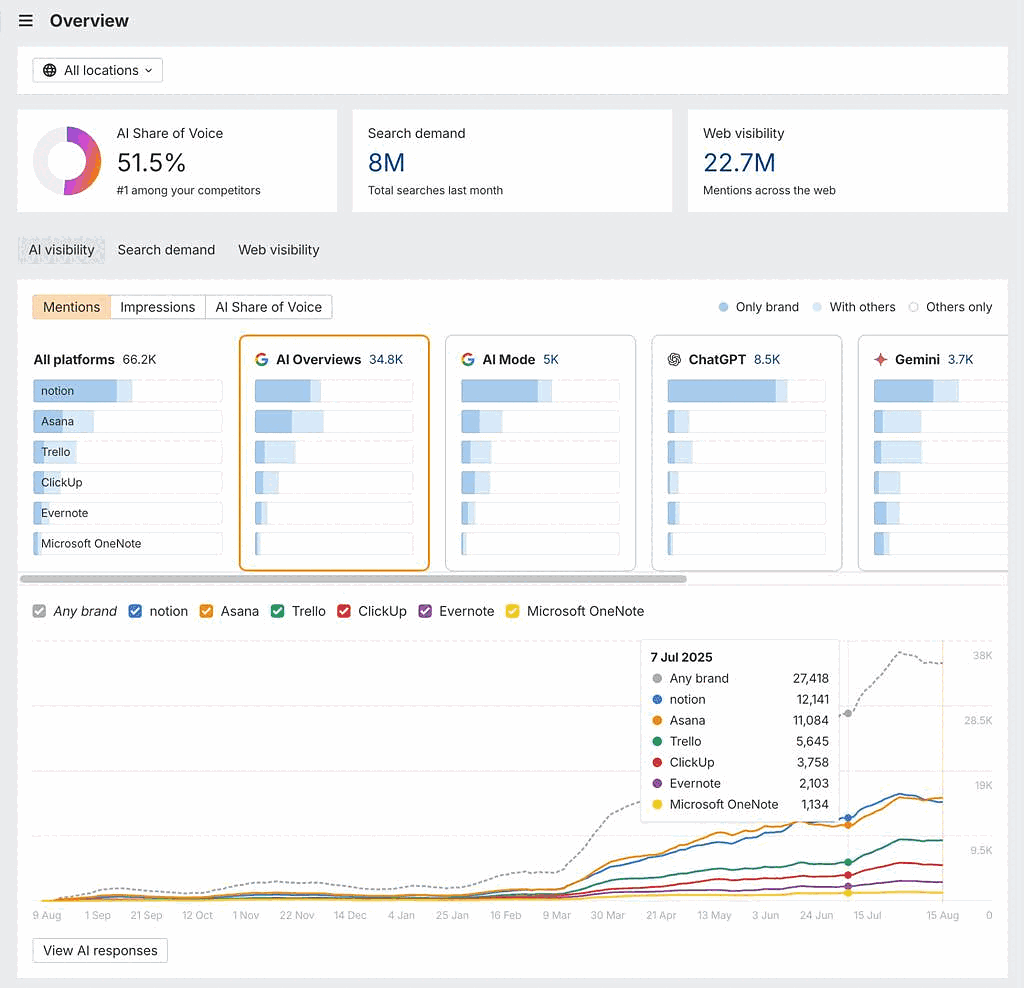
Teams using a separate platform (like Ahrefs or Semrush) can also review AI visibility, but these reports are still new and evolving.
Review visibility alongside referral and engagement data:
A page with modest traffic can still be doing important work. If AI platforms repeatedly send people there, the page may be answering a specific question especially well.
Start with the pages already receiving AI traffic. Refresh old statistics, add expert commentary, strengthen the sourcing, make the author’s expertise clear, and connect informational pages with relevant product or conversion content.
Content decay never arrives with flashing lights and an alarm. A dependable page usually loses ground a little at a time as rankings shift, search demand changes, competitors improve, and search results absorb more clicks.
Looking at keyword and page trends together helps you catch those losses while the page still has something worth saving.
Ahrefs, Semrush, or another enterprise SEO platform
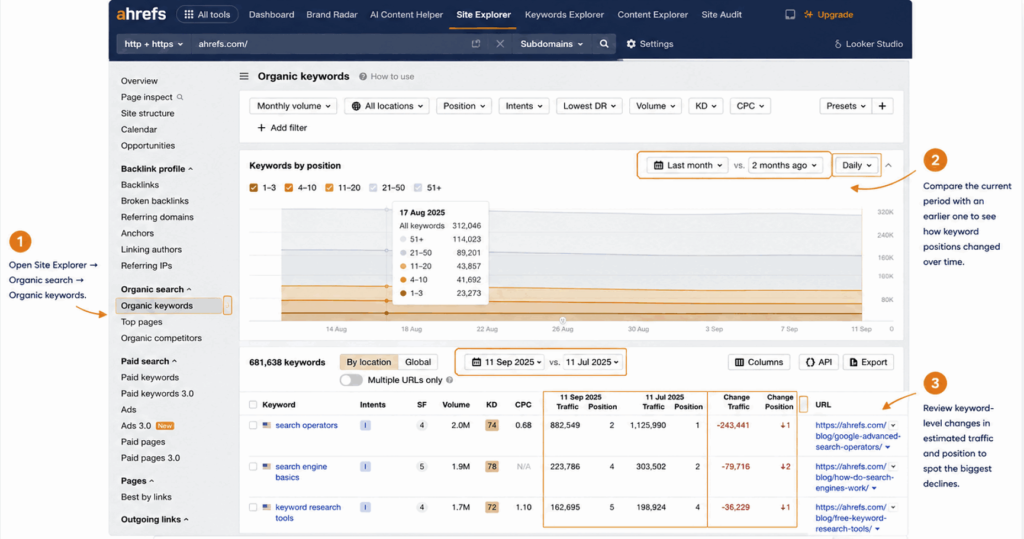
In Ahrefs, open Site Explorer → Organic search → Organic keywords and compare the current period with an earlier one. Then review Top pages to see which URLs account for the largest estimated traffic losses.
Semrush and other enterprise SEO platforms offer similar keyword-position and page-trend reports. The labels change, but the workflow stays the same: compare periods, find the declining keywords, and connect those losses with the pages that rank for them.
Focus on declines that could affect the business:
When several related keywords fall together, you may be looking at a broader topic or intent problem. A quick copy edit won’t rescue a page when competitors answer a more useful question.
Start with pages that already have valuable rankings, links, and conversion potential. Update old evidence, strengthen thin sections, add current examples, and improve internal links from related pages.
Check the live search results before you start editing. If Google now favors a different format or intent, respond to that change. Adding another 500 words to an old article that’s no longer ranking is unlikely to help.
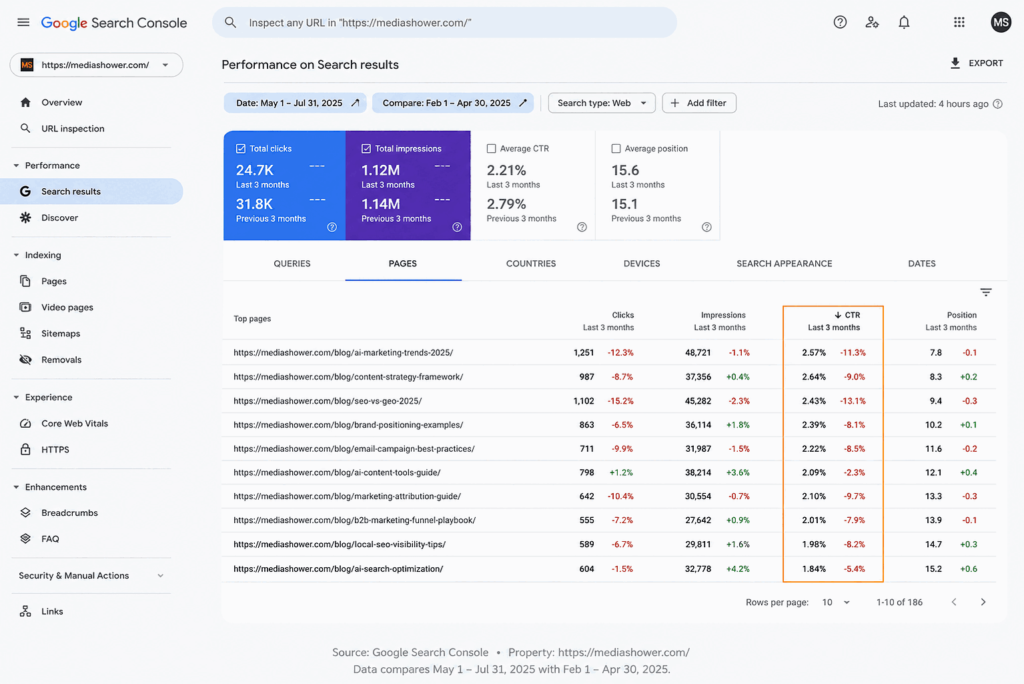
A drop in traffic doesn’t automatically mean your rankings fell. Search demand may be lower, or CTR may have changed. AI-generated results may be absorbing clicks while your positions hold steady.
A rank tracker helps separate those possibilities by showing how a chosen group of keywords moves over time.
Ahrefs Rank Tracker
Open Ahrefs Rank Tracker → Overview.
Look for the reports that show:
Position history is especially helpful because it shows whether you have one wobbly keyword or a broader pattern.
Pay attention when:
One lost position may be ordinary search volatility. A steady decline across keywords that matter to the business is worth investigating.
Open the current search results and compare your page with the competitors that moved ahead. Check freshness, intent, evidence, structure, and how fully each page answers the query.
Update valuable pages before they slide off page one. Refresh the examples and statistics, improve internal linking, and strengthen any section where a competing page now gives the reader a clearer or more current answer.
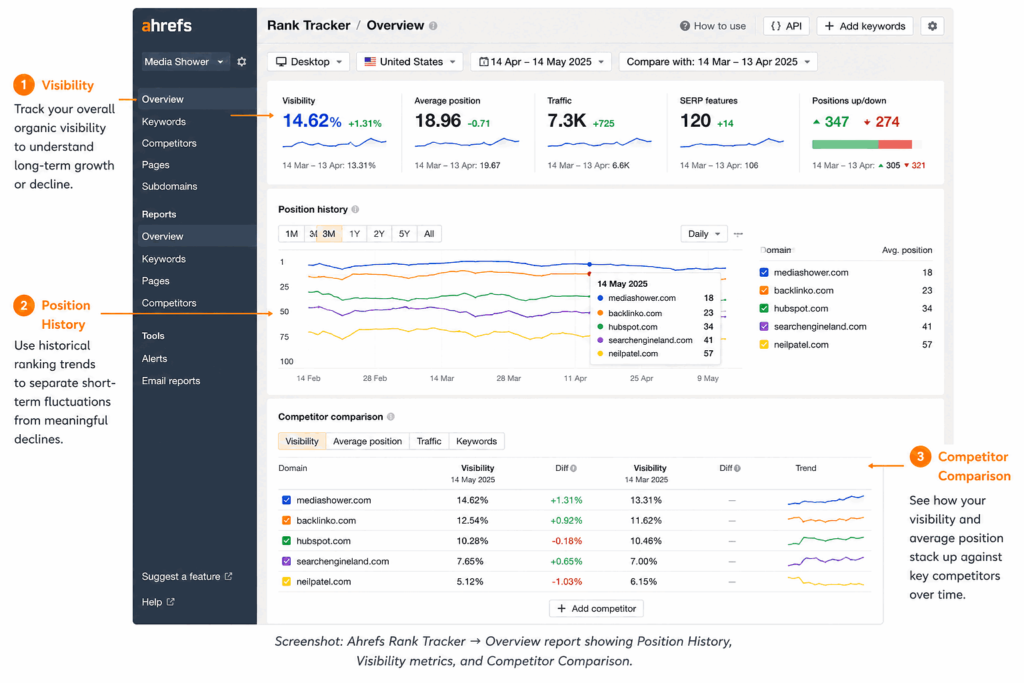
The first Search Console review tells you whether organic performance is changing overall. A page-level CTR review shows which URLs are driving that change.
A page can hold its ranking and still bring in fewer visits. It remains visible, but the search result has become less appealing or less necessary to click.
Google Search Console
Open Performance → Search Results → Pages, then compare the last three to six months with the preceding period.
Turn on clicks, impressions, average CTR, and average position. Sort by the difference columns, then look for pages that kept roughly the same visibility while losing clicks.
The clearest pattern combines three signals:
That pattern gives you a lead, not a culprit. Search the page’s leading queries and review the current results. You may find an AI Overview, a featured snippet, a richer competing listing, or a shift in what people want from the query.
Start with the snippet people see. If the title and meta description no longer communicate the page’s value, sharpen them. Check that any structured data is accurate and appropriate for the content.
Then look at what visitors get after the click. Original data, calculators, templates, downloadable resources, and experienced analysis can make the trip worthwhile even when Google has already provided the short answer.
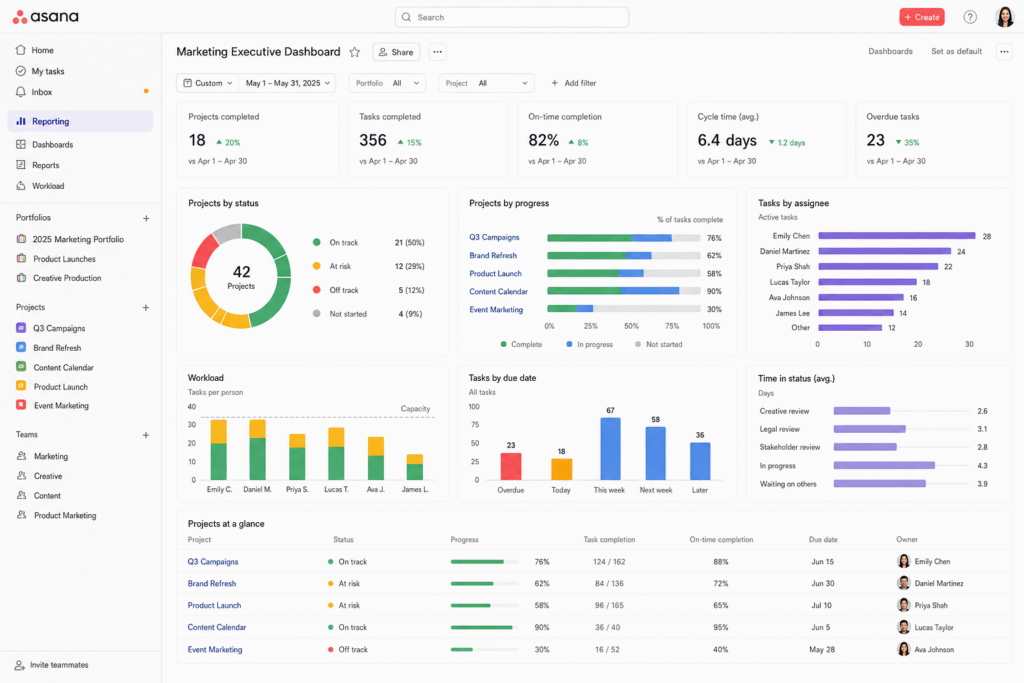
AI may help someone write a first draft faster while doing very little for the rest of the production process. The campaign can still spend a week waiting for review, design, legal approval, or publishing.
Your project-management data shows whether the whole workflow is moving faster. It can also show you where the saved time disappears.
Asana, monday.com, Jira, or your team’s project-management platform
Review or build reports for:
You may need to build some of these reports. Reliable cycle-time and capacity data depends on consistent status fields, timestamps, workload estimates, and a dashboard that brings them together.
Compare similar work from before and after AI entered the workflow. Keep an eye on other changes, including project complexity, team size, demand, and approval requirements. Otherwise, you may give AI credit for a lighter month or blame it for a heavier one.
Look for shorter cycle times, greater throughput, fewer delayed campaigns, and a healthier spread of work across the team. Keep a quality measure nearby. Faster output loses its charm when every project comes back for two extra rounds of revision.
Find the stage where work still waits. If AI speeds up drafting while approval time stays exactly the same, your next opportunity is sitting in the review process.
Treat time-saved figures as estimates unless the team has documented task baselines. The stronger story combines faster delivery, steady quality, and a workload people can actually sustain.
Faster marketing becomes more valuable when it helps the business grow profitably. CRM and financial data show whether your work is creating qualified opportunities, customers, and revenue.
These numbers also keep the AI conversation grounded. A team can produce twice as much content and still end up with the same pipeline.
HubSpot, Salesforce, or your organization’s CRM and business-intelligence system
Review dashboards that cover:
These metrics depend on clean CRM data, connected costs, agreed lifecycle definitions, and a documented attribution model. A beautiful dashboard can organize messy data, but it can’t make that data trustworthy.
Look at the direction of each metric and the relationships among them. Lower CAC is good news when lead quality and customer value remain healthy. A growing pipeline is encouraging when those opportunities keep moving toward closed-won revenue.
If you track AI referrals or AI-influenced journeys, compare their pipeline and revenue performance with other sources. Describe the result as an association unless your measurement setup can support a stronger claim.
If cycle time and throughput improve while CAC, pipeline, and revenue stay flat, find the broken link. The team may be producing faster without reaching a better audience or creating stronger demand.
Use CRM data to decide where AI-assisted efficiency deserves more investment. The most convincing case connects an operational gain with a business result through clear definitions and reliable tracking.
| Business question | Best tool or report |
| Is organic search declining because of AI? | Google Search Console, followed by a live SERP review |
| Am I getting more AI referrals? | Google Analytics 4 Traffic acquisition |
| Am I visible in AI search? | Media Shower AI Visibility reporting or a dedicated AI visibility platform |
| Which keywords are disappearing? | Ahrefs, Semrush, or another enterprise SEO platform |
| Are my rankings dropping? | Ahrefs Rank Tracker or a comparable rank tracker |
| Which pages have declining CTR? | Google Search Console Pages report |
| Is AI speeding up production? | Asana, monday.com, Jira, or another project-management platform |
| Are CAC, LTV, and pipeline improving? | HubSpot, Salesforce, or your organization’s CRM and BI system |
Media Shower’s AI marketing platform helps brands turn AI metrics into measurable marketing momentum. Click here for a free trial.